Search Results

Search results for 'Weekly' (90)

A woman is pointing at a lightning bolt on a purple background.
by Thomas McGlynn 22 July 2026
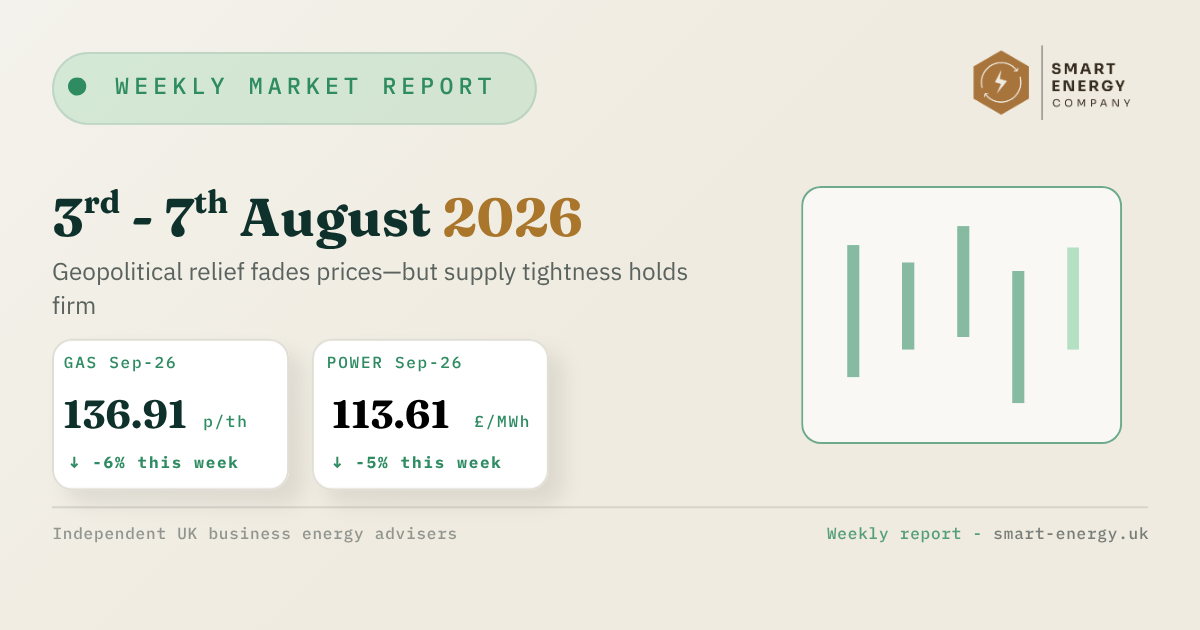
Get the latest UK gas and electricity wholesale prices. Updated daily with power market insights, price trends, and tips to help your business stay ahead.
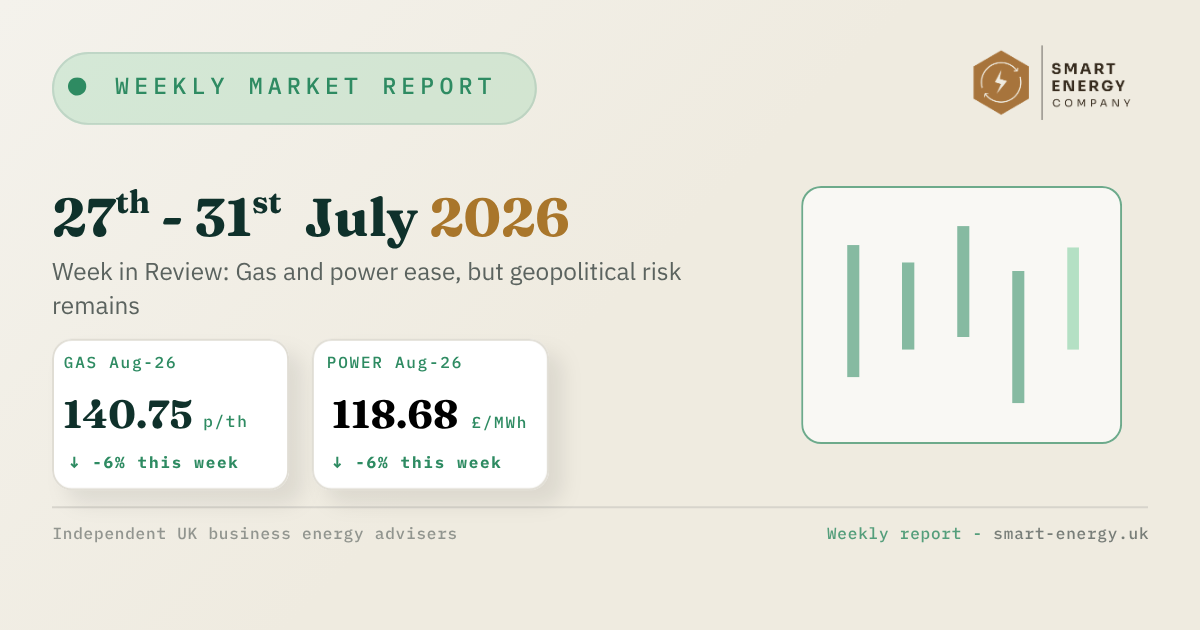
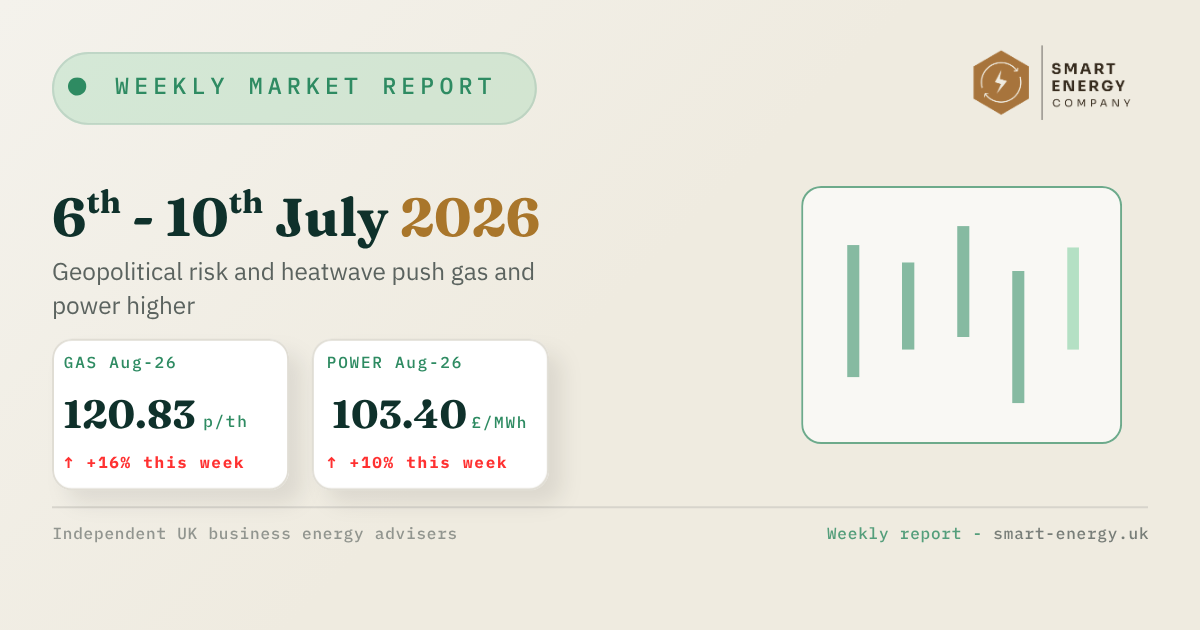
Weekly market report dashboard with beige background, July 2026 date, two metrics, and a green bar chart
by Thomas McGlynn 13 July 2026
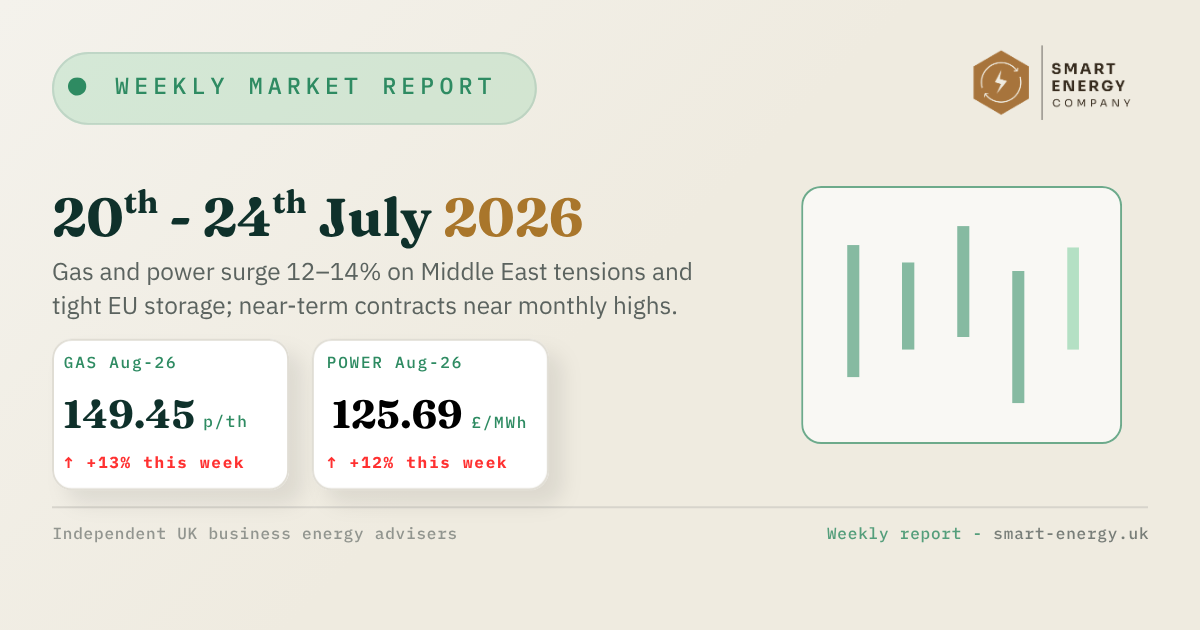
Gas and power both climbed sharply this week on Middle East tensions and summer heat. Near-term renewals now worth reviewing.
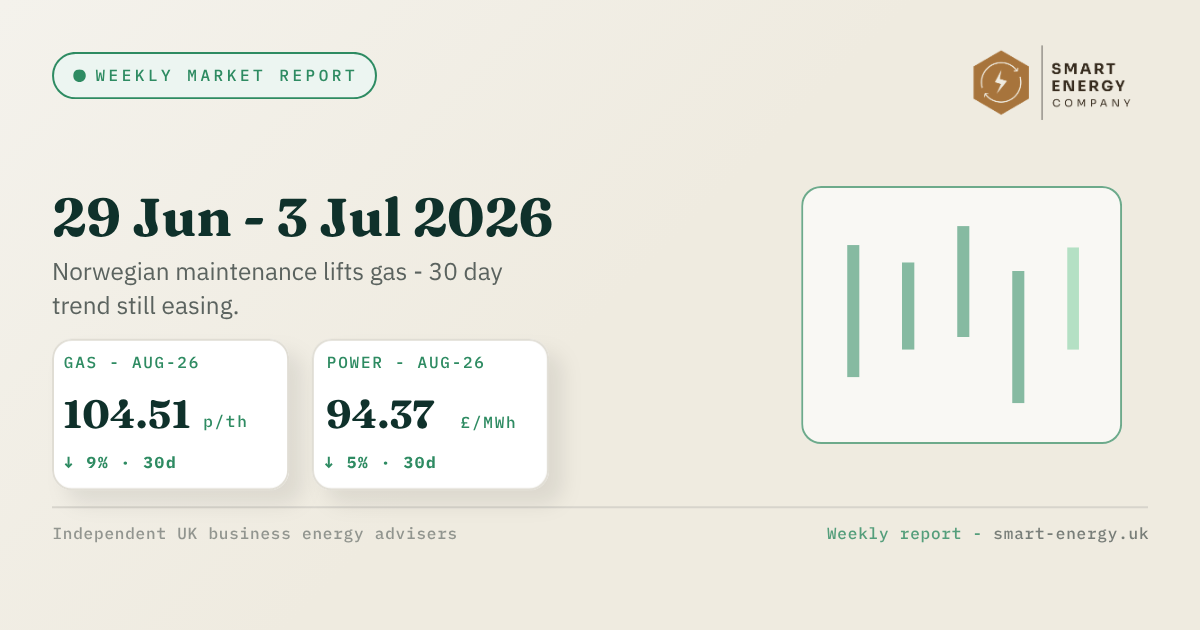
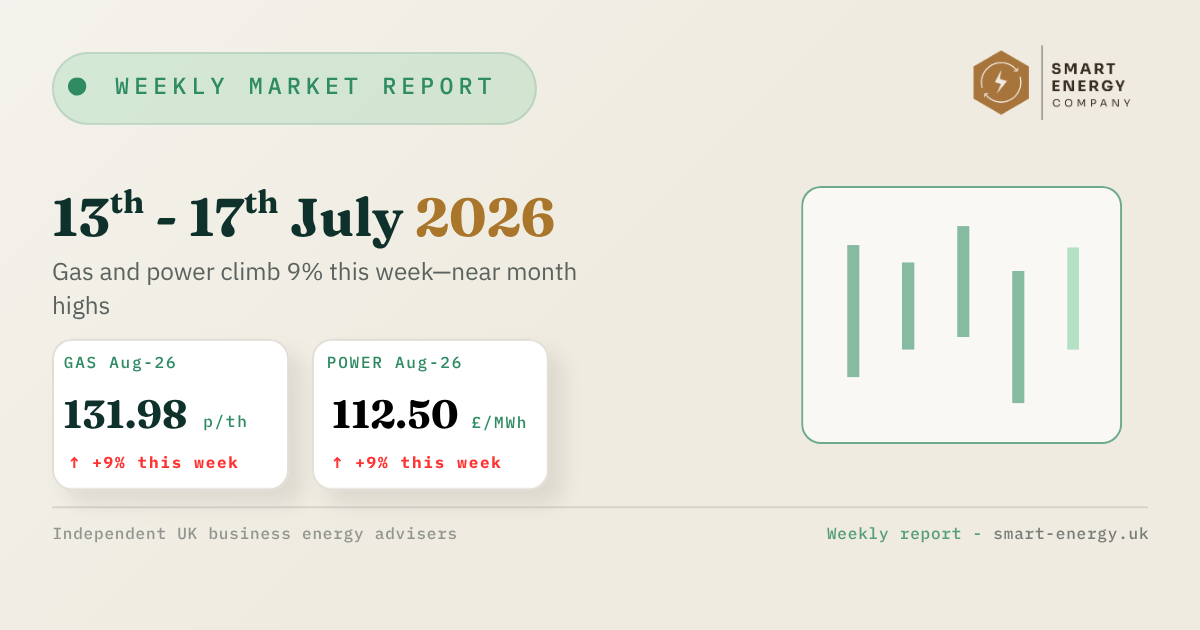
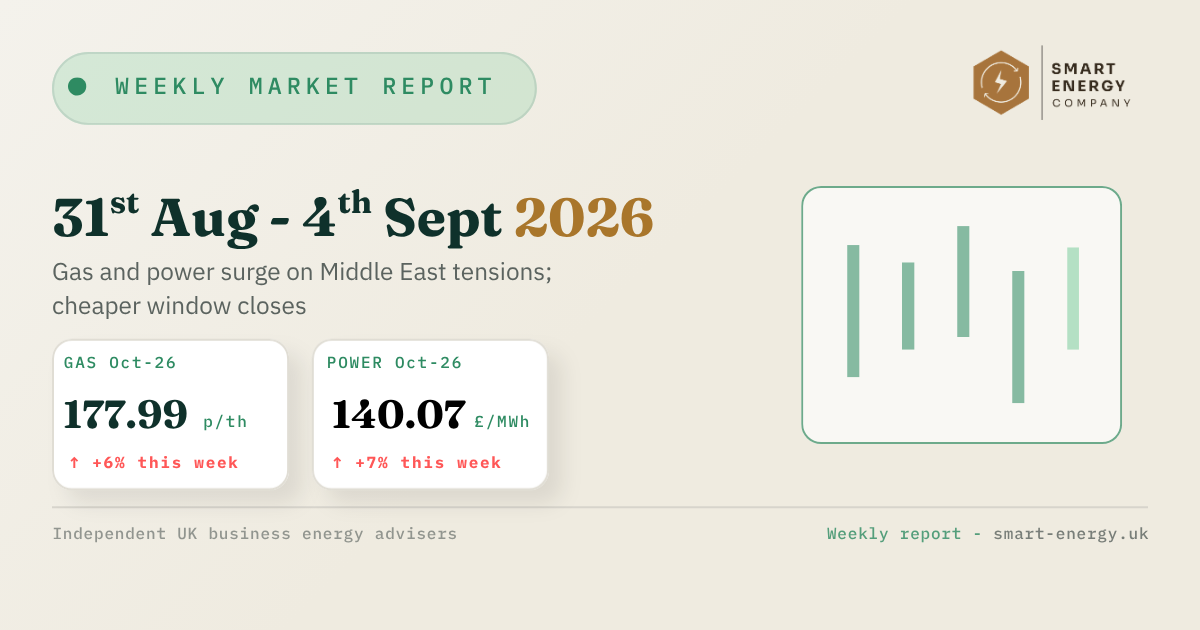
Dashboard-style weekly report with beige background, date range, stat cards, and a green bar chart
by Thomas McGlynn 6 July 2026
Week 27. Gas up 8.3% to 104.51p but down 9.2% over 30 days; power up 7.2% to £94.37 but down 4.6% over 30 days. Watch for Norwegian maintenance end on 8 July.
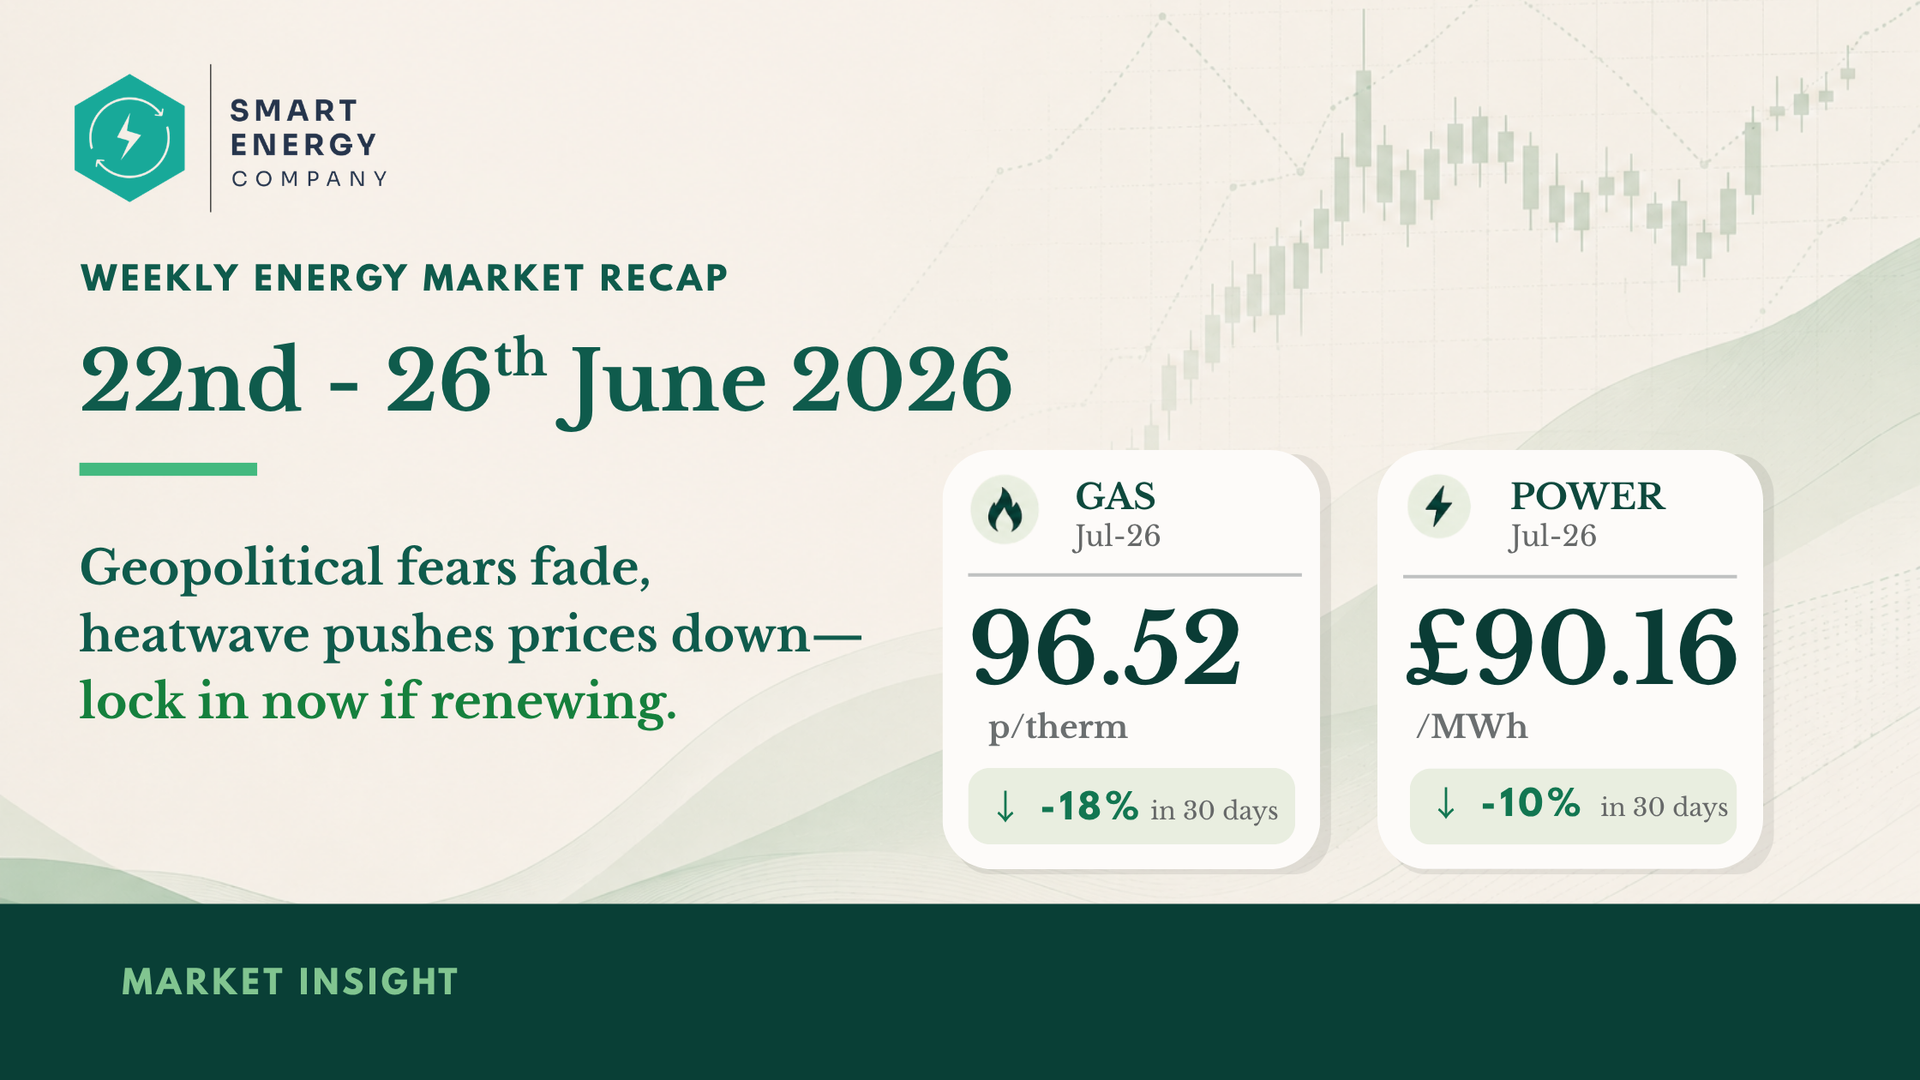
Weekly energy market recap with gas and power price cards, dated 22nd–26th June 2026.
by Thomas McGlynn 29 June 2026
Week 26 energy update: gas down 18% in 30 days to 96.52p, power down 10% to £90.16/MWh. Middle East ceasefire and heatwave easing prices. Renew now if you're in next
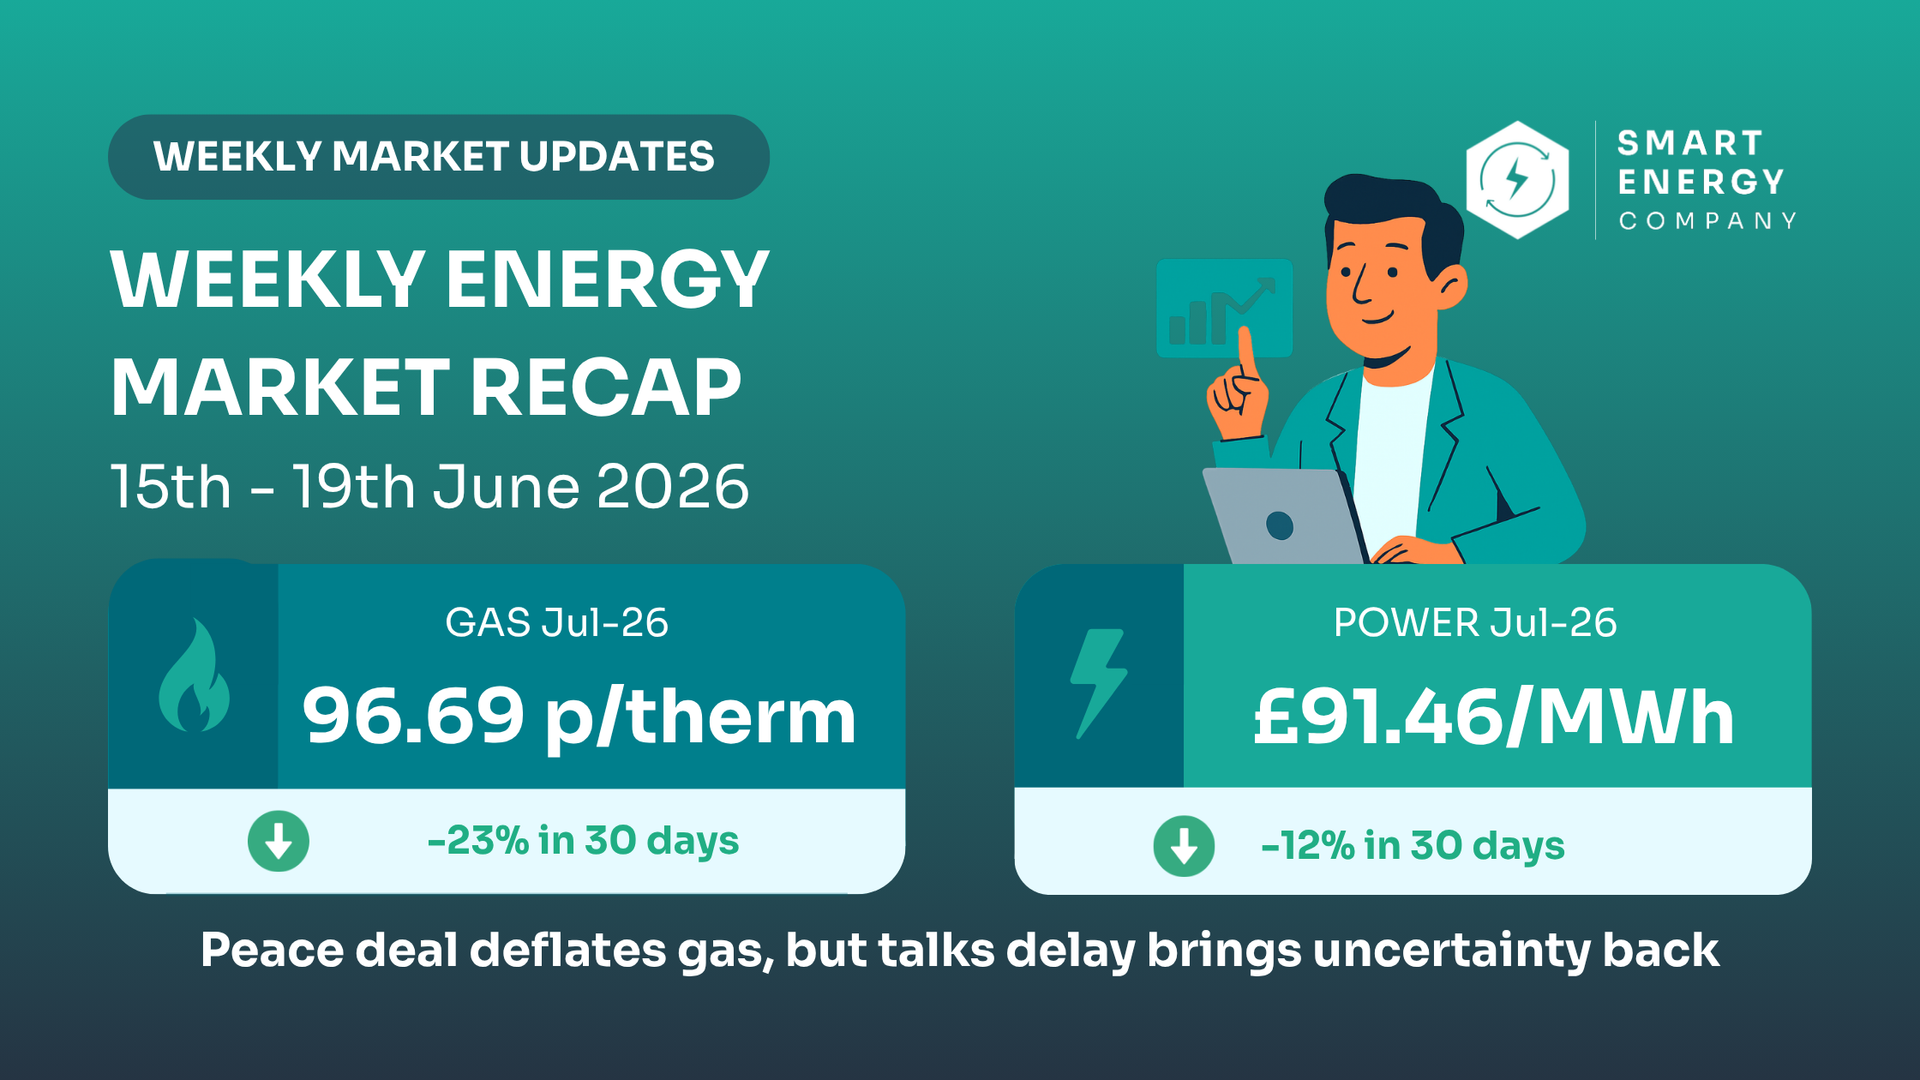
Weekly energy market recap infographic with gas and power price declines, teal background, cartoon analyst, and charts
by Thomas McGlynn 22 June 2026
Week 25: Gas fell 23.3% over 30 days to 96.69p, power down 12.2% to £91.46/MWh. US-Iran peace deal eased geopolitical risk, but Friday's talks delay brought caution
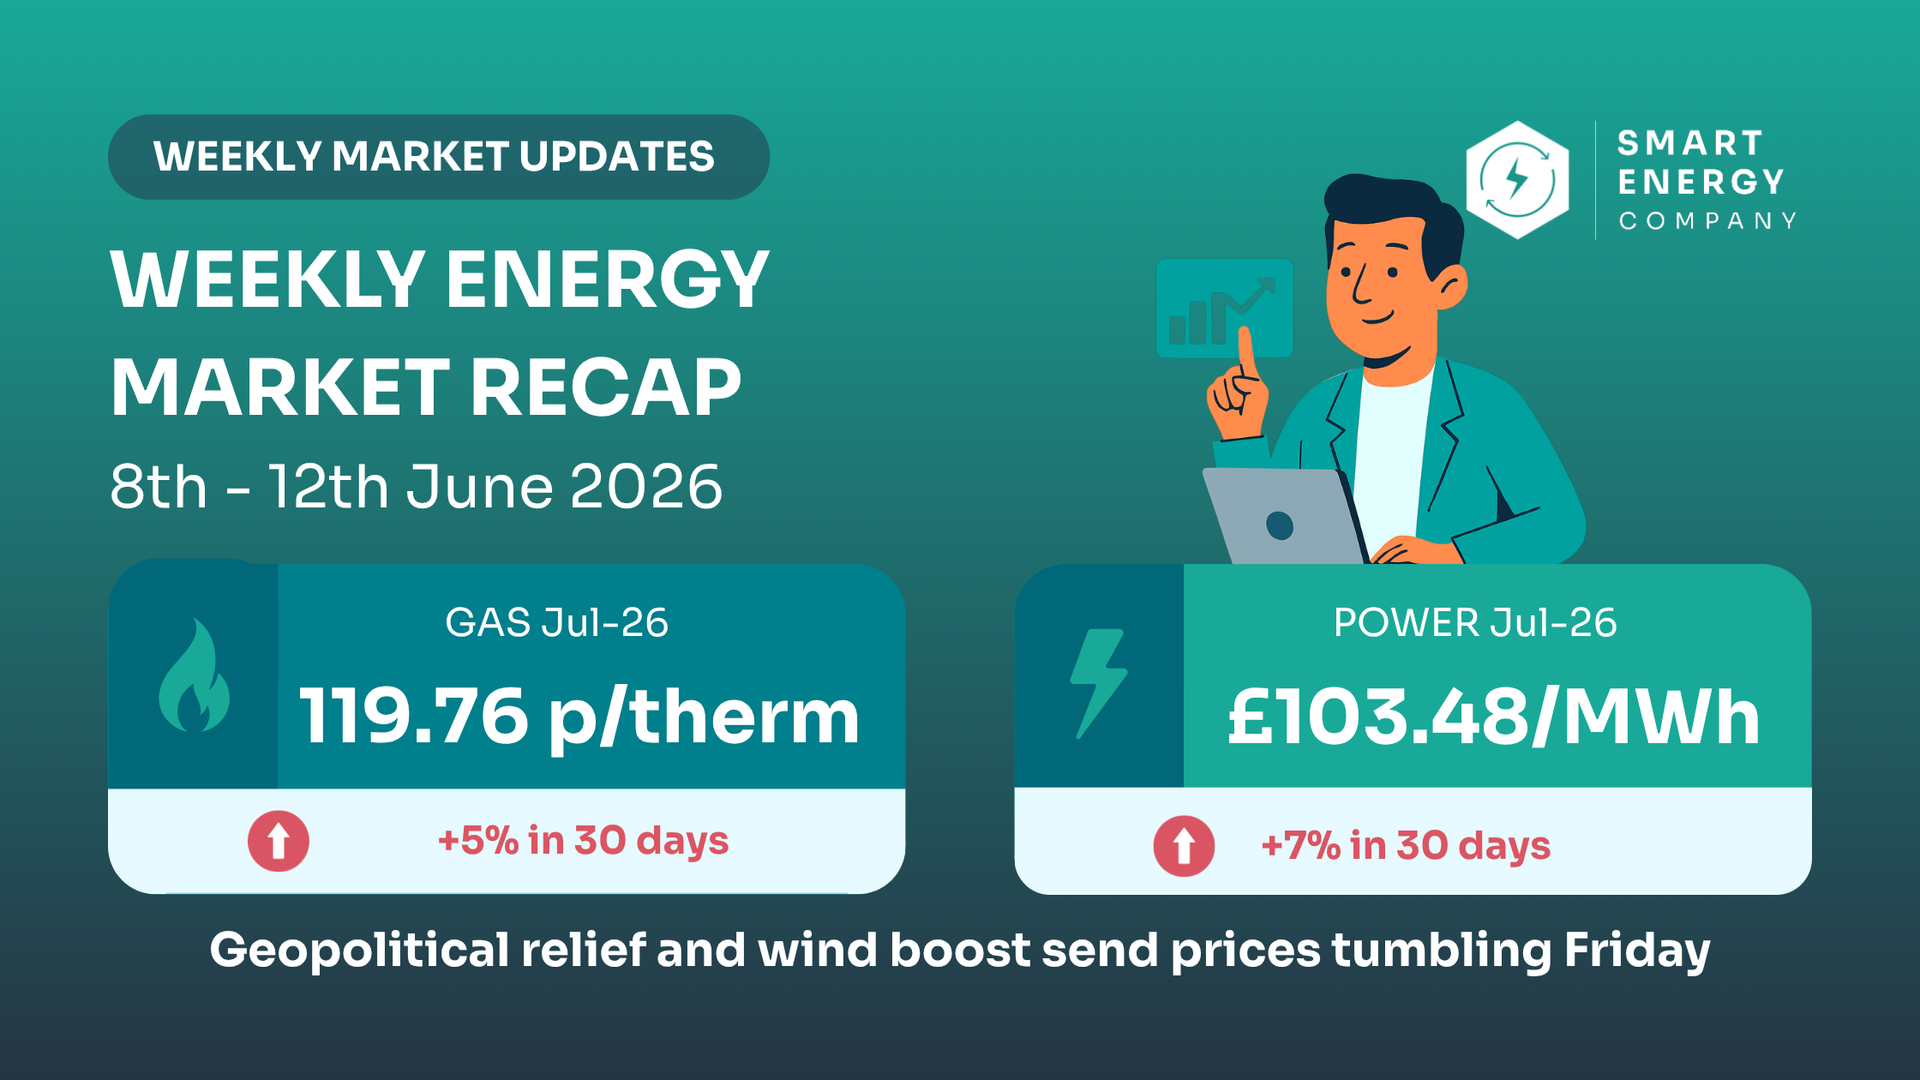
Weekly energy market recap infographic with teal panels and cartoon analyst, showing gas and power prices down.
by Thomas McGlynn 15 June 2026
Week 24. Gas up 5.3% in 30 days but fell 6.8% Friday as US–Iran tensions eased and wind improved; power similar. Near-term momentum turning down—watch, don't rush.
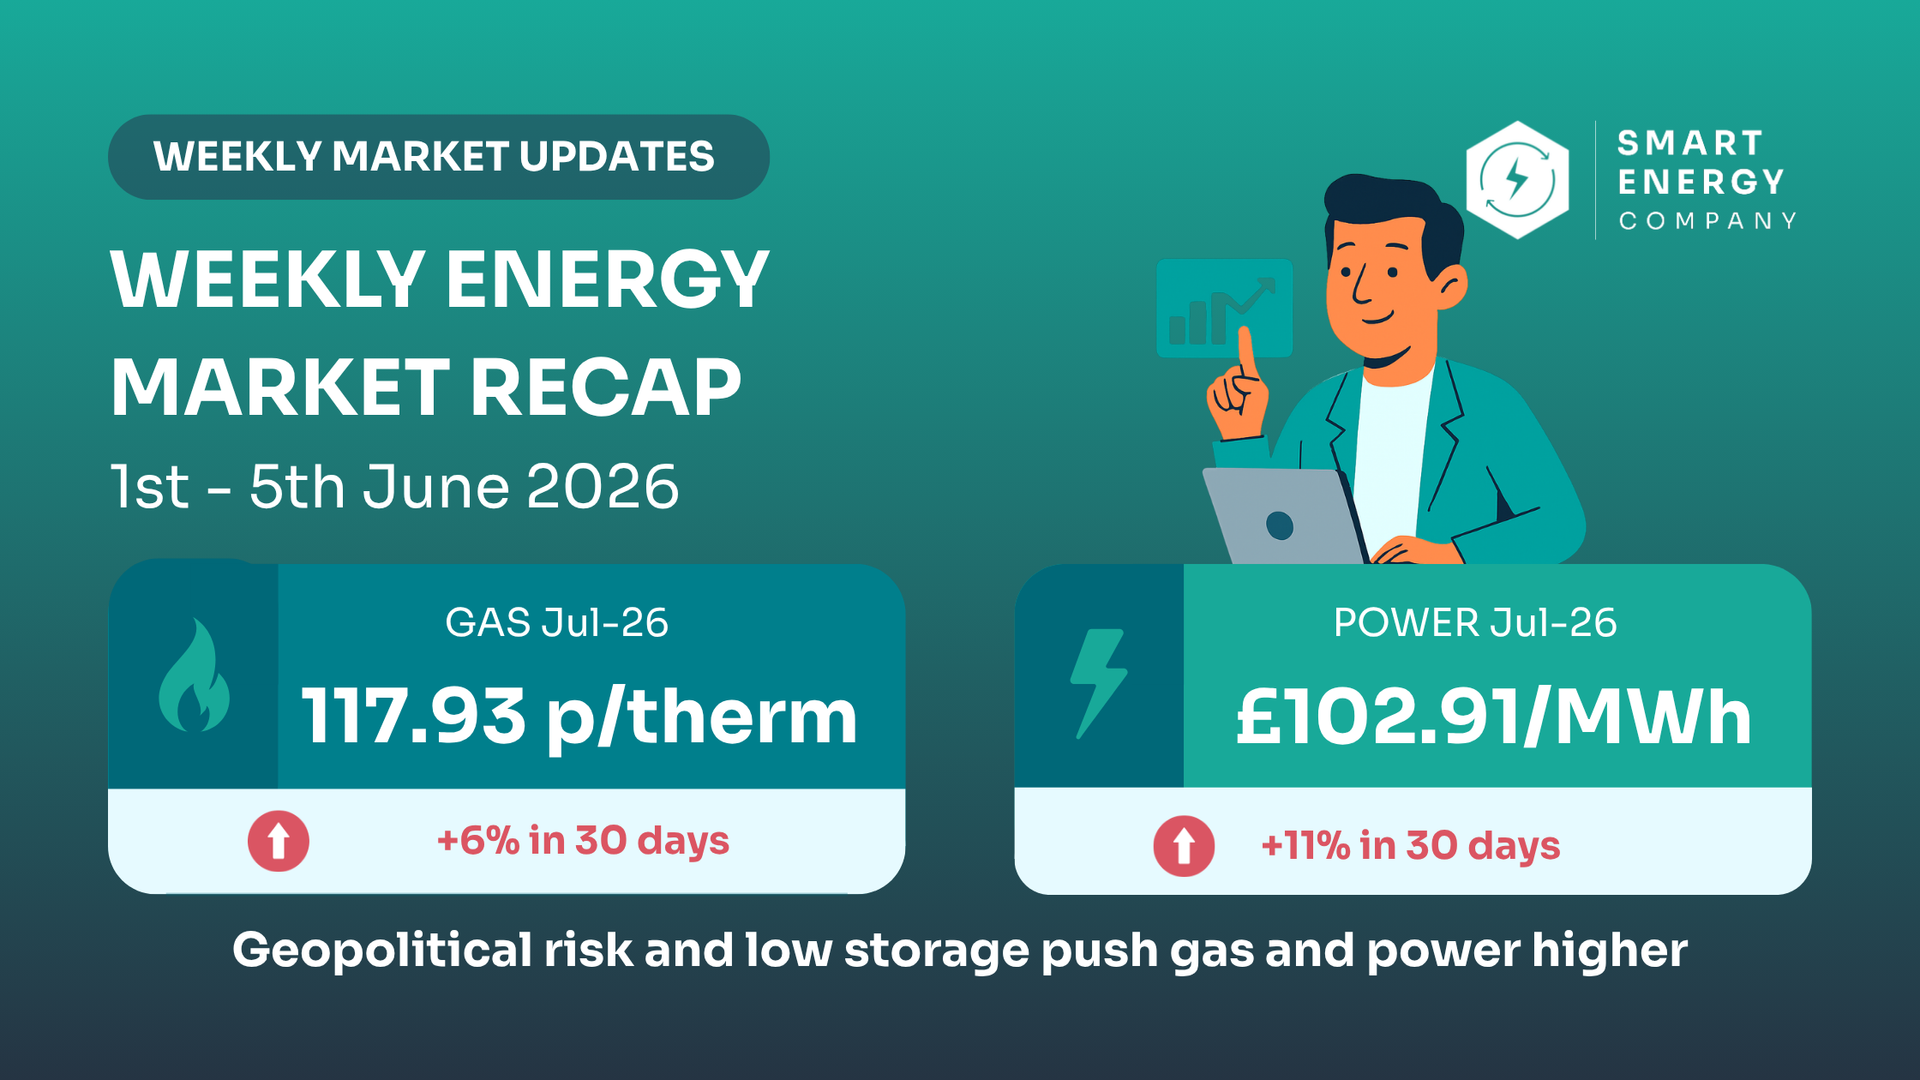
Weekly energy market recap infographic with gas and power price figures on teal background
by Thomas McGlynn 8 June 2026
Week 23: Gas up 6% in 30 days, power up 10.8%. Middle East tensions and Norwegian strike threat keep prices rising. Get quotes if renewing soon.
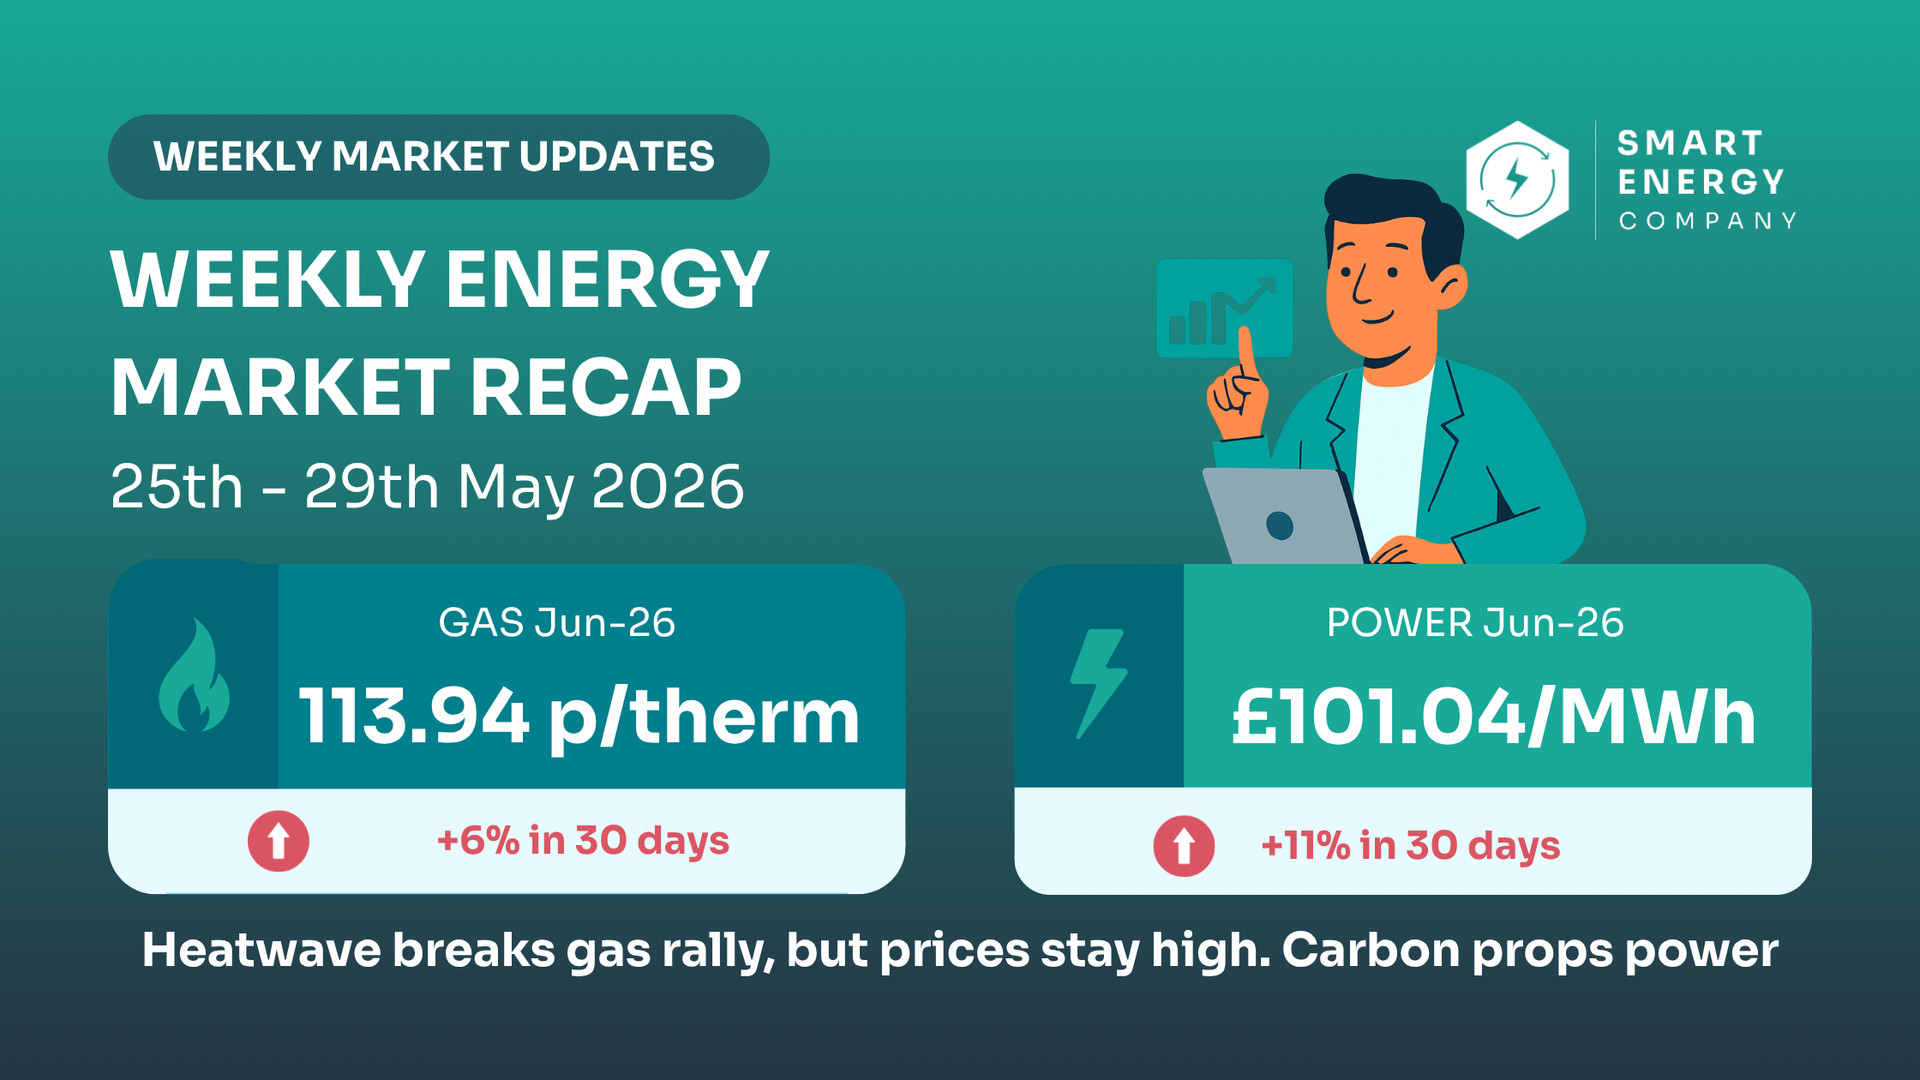
Weekly energy market recap infographic showing heatwave-driven high gas and power prices, teal and red panels
by Thomas McGlynn 1 June 2026
Week 22: Gas eased 5.7% on record heatwave and LNG supply gains, but remains 6.1% up over 30 days. Power fell 1.1%, held up by rising carbon. Watch before renewing.
Weekly energy market recap infographic: gas and power prices with cartoon figure on teal background
by Thomas McGlynn 26 May 2026
Week 21. Gas up 4.1% on the week to 120.37p as Iran tensions flared, despite a 4.5% Thursday drop. Near-term contracts up 20-28% in 30 days.
Weekly energy market recap graphic showing a cartoon analyst and gas price spikes on teal background
by Thomas McGlynn 18 May 2026
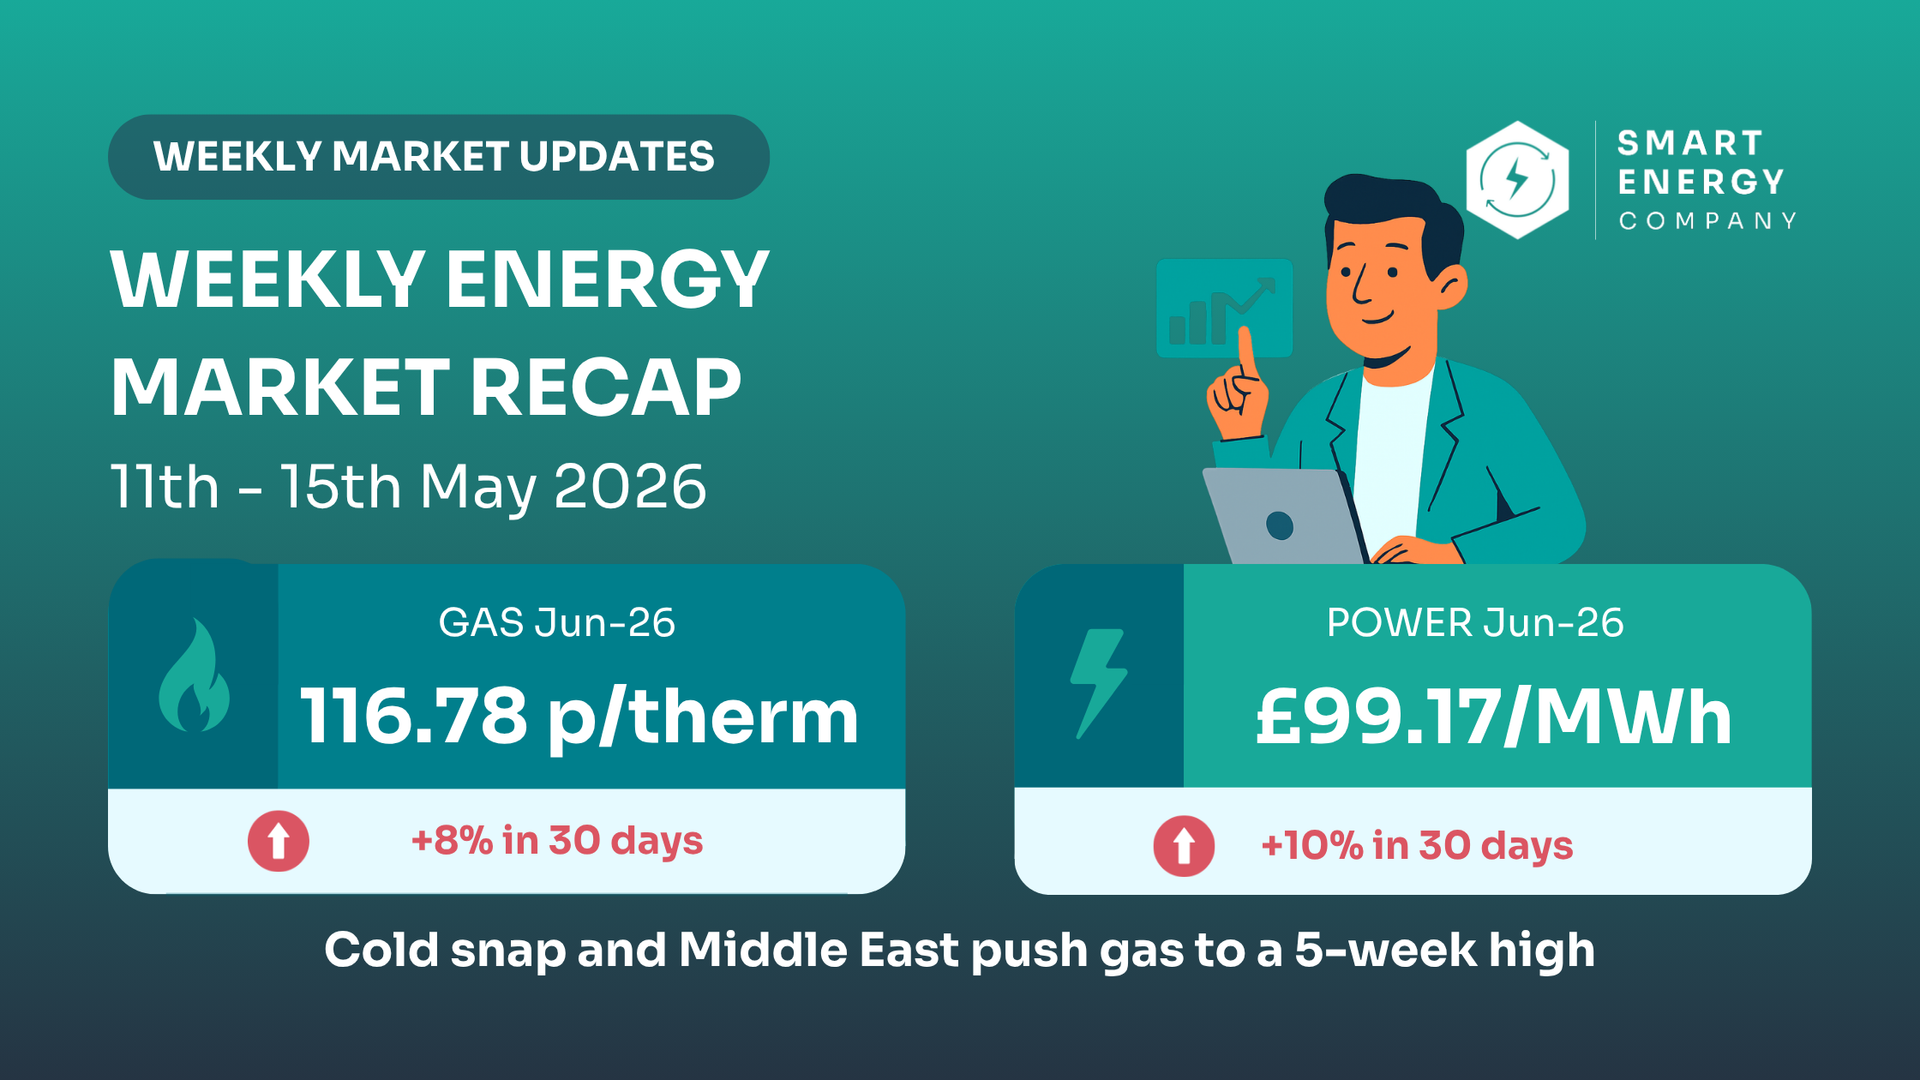
Week 20. Gas up 8.1% to 115.60p — a 5-week high driven by cold snap and Middle East tensions. Get quotes if renewing in 2026.
Weekly energy market recap infographic with gas and power prices, teal background and cartoon analyst
by Thomas McGlynn 11 May 2026
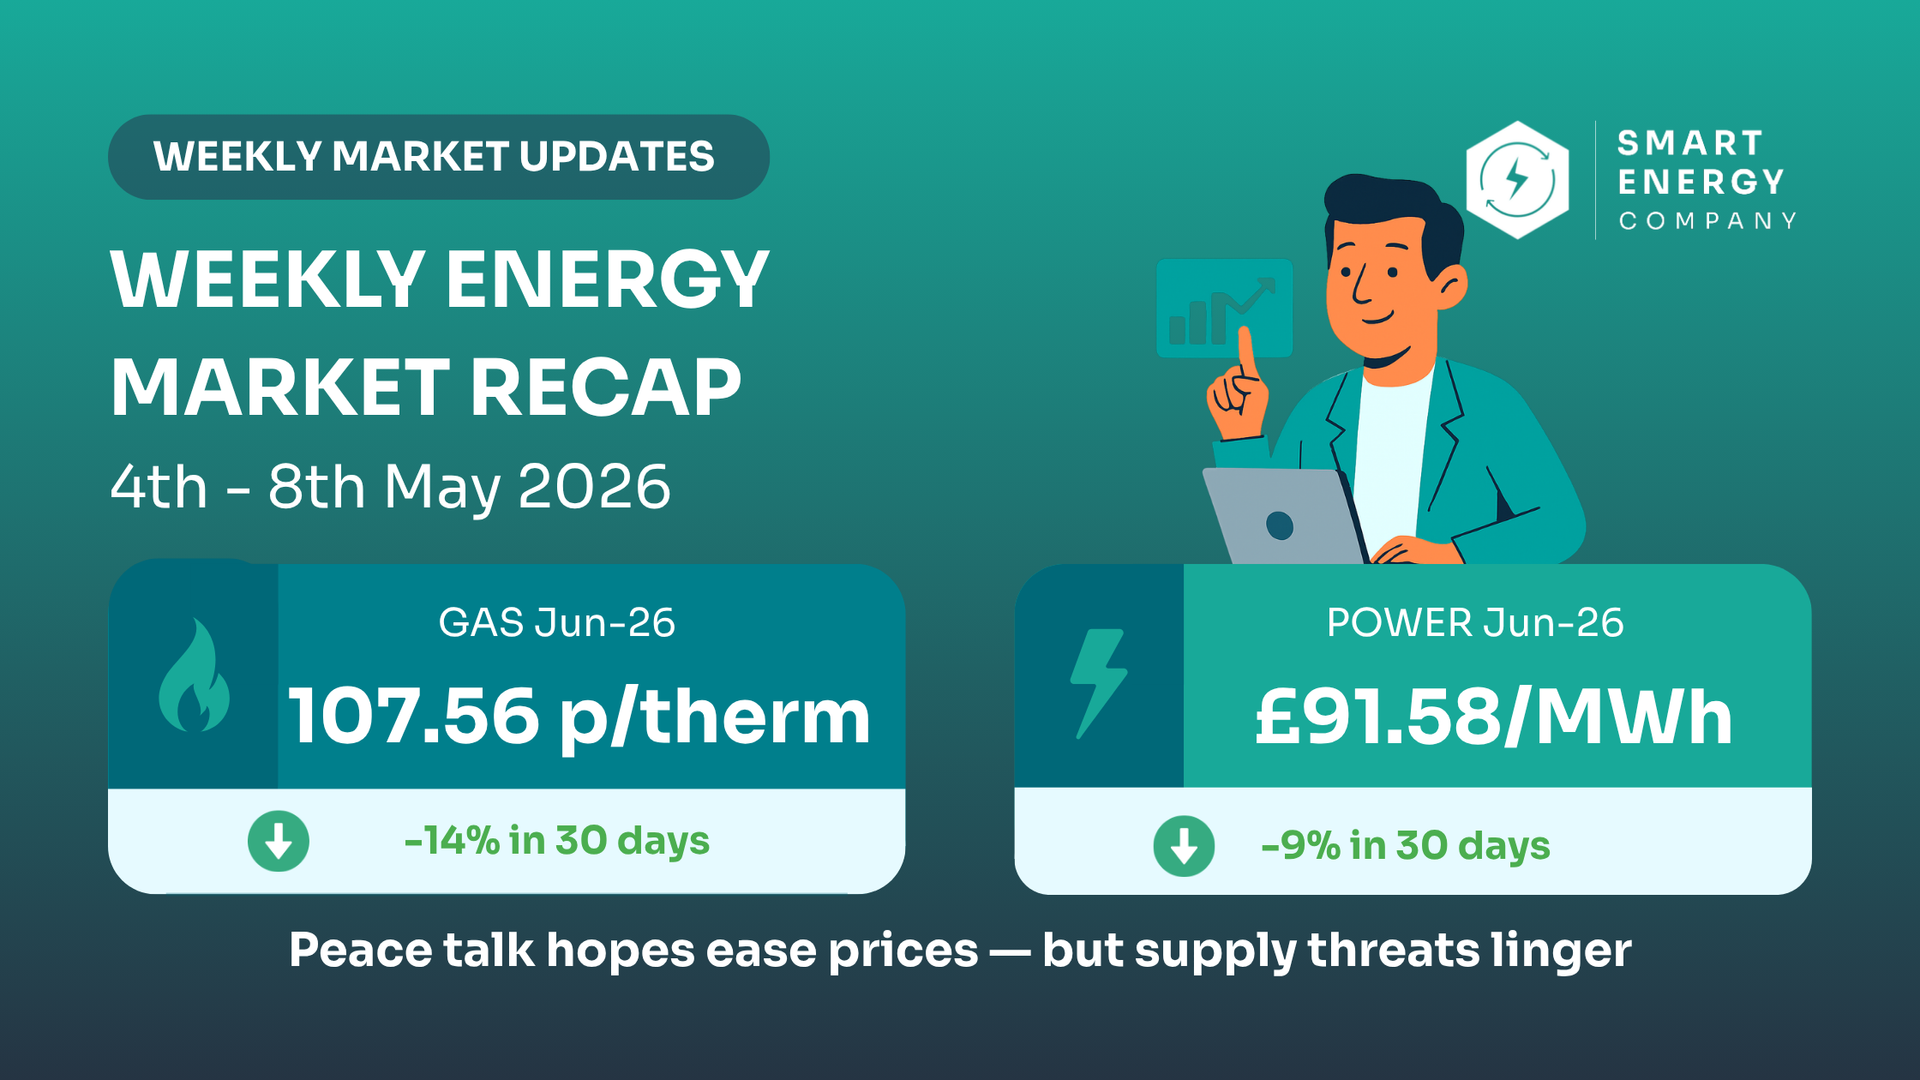
Week 19. Gas fell 4.8% as US-Iran peace talk hopes eased prices — but Hormuz tensions and Qatar outages keep supply tight. Watch closely.
Weekly energy market recap infographic with gas and power price updates on a teal background.
by Thomas McGlynn 5 May 2026
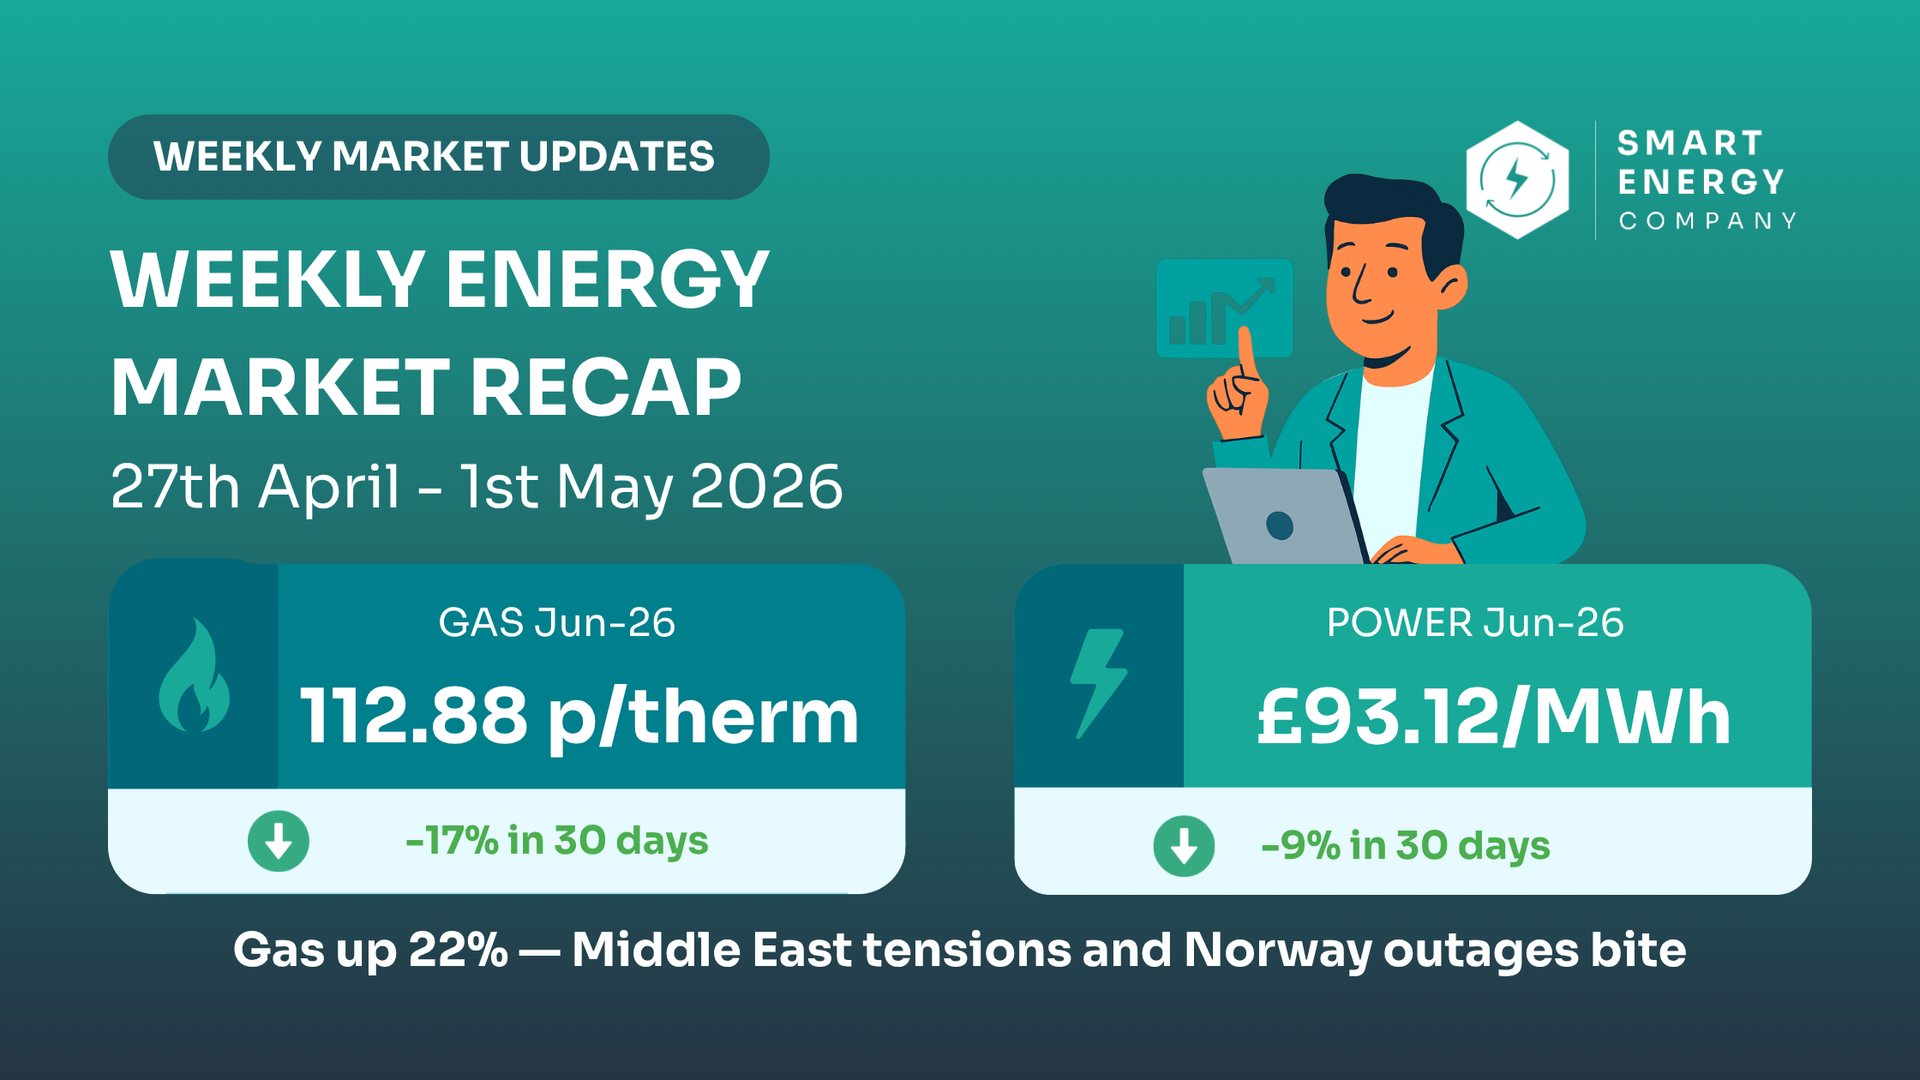
Week 18. Gas up 22.6% to 111.96p as Middle East tensions and Norwegian outages hit supply. Get quotes if renewing in 2026.

Weekly energy market update infographic showing gas at 106.69 p/therm and power at 86.77/MWh
by Thomas McGlynn 27 April 2026
Week 17. Gas up 9.7% as Middle East ceasefire collapses — but still 20% below 30 days ago. Get quotes if renewing in 2026.
Weekly Energy Market Recap infographic with gas and power prices on teal panels and a cartoon man pointing at charts
by Thomas McGlynn 20 April 2026
Week 7. Gas down 11.5% on Trump talks hint — best week of the conflict. But weekend Hormuz reclosure and US vessel seizure reversed the optimism.
Smart Energy Company infographic showing gas at 106.69 p/therm and power at £86.77/MWh for 7th–10th April 2026.
by Thomas McGlynn 13 April 2026
Week 6. Ceasefire crashed gas 14% then prices bounced. No LNG through Hormuz. Gas down 9% on the week — then peace talks collapsed over the weekend.
Smart Energy Company market recap infographic: Gas at 120.42 p/therm and Power at £102.73/MWh, both down 11–13% in 30 days.
by Thomas McGlynn 7 April 2026
Week 5. May-26 gas down 11% in 30 days — first real drop since the conflict. Power down 13%. Contracts rolled. What it means for your renewal.
Quarterly energy market review poster in purple and teal with a chart, titled
by Thomas McGlynn 1 April 2026
Q1 2026: gas doubled and power rose 40% after Operation Epic Fury reshaped global LNG supply. Full quarterly breakdown and Q2 outlook for UK businesses.
Weekly market update infographic: Gas at 137.77 p/therm and Power at £102.73/MWh, with text noting a 10% gas price drop.
by Thomas McGlynn 30 March 2026
Week 4. Gas down 10% — biggest weekly fall since the conflict. Trump's ultimatum spiked gas to 159p then sold off. 10 tankers through Hormuz. What it means for you
Weekly energy market update from 16th-20th March 2026: Gas at 156.64 p/therm, Power at £109.72/MWh, noting supply disruption.
by Thomas McGlynn 23 March 2026
Week 3. Kharg Island demolished. South Pars struck. Ras Laffan 17% offline for 3-5 years. Gas up 24% this week, 121% in 30 days. What it means for your contract.
Weekly energy market recap for March 9-13, 2026, showing gas at 129.35 p/therm and power at £97.38/MWh with market volatility.
by Thomas McGlynn 16 March 2026
Gas peaked at 135p, crashed 11%, bounced back to 124p. Brent hit $119 then $88 then $105. IEA: largest supply disruption in history. What it means for your contract.
Show More