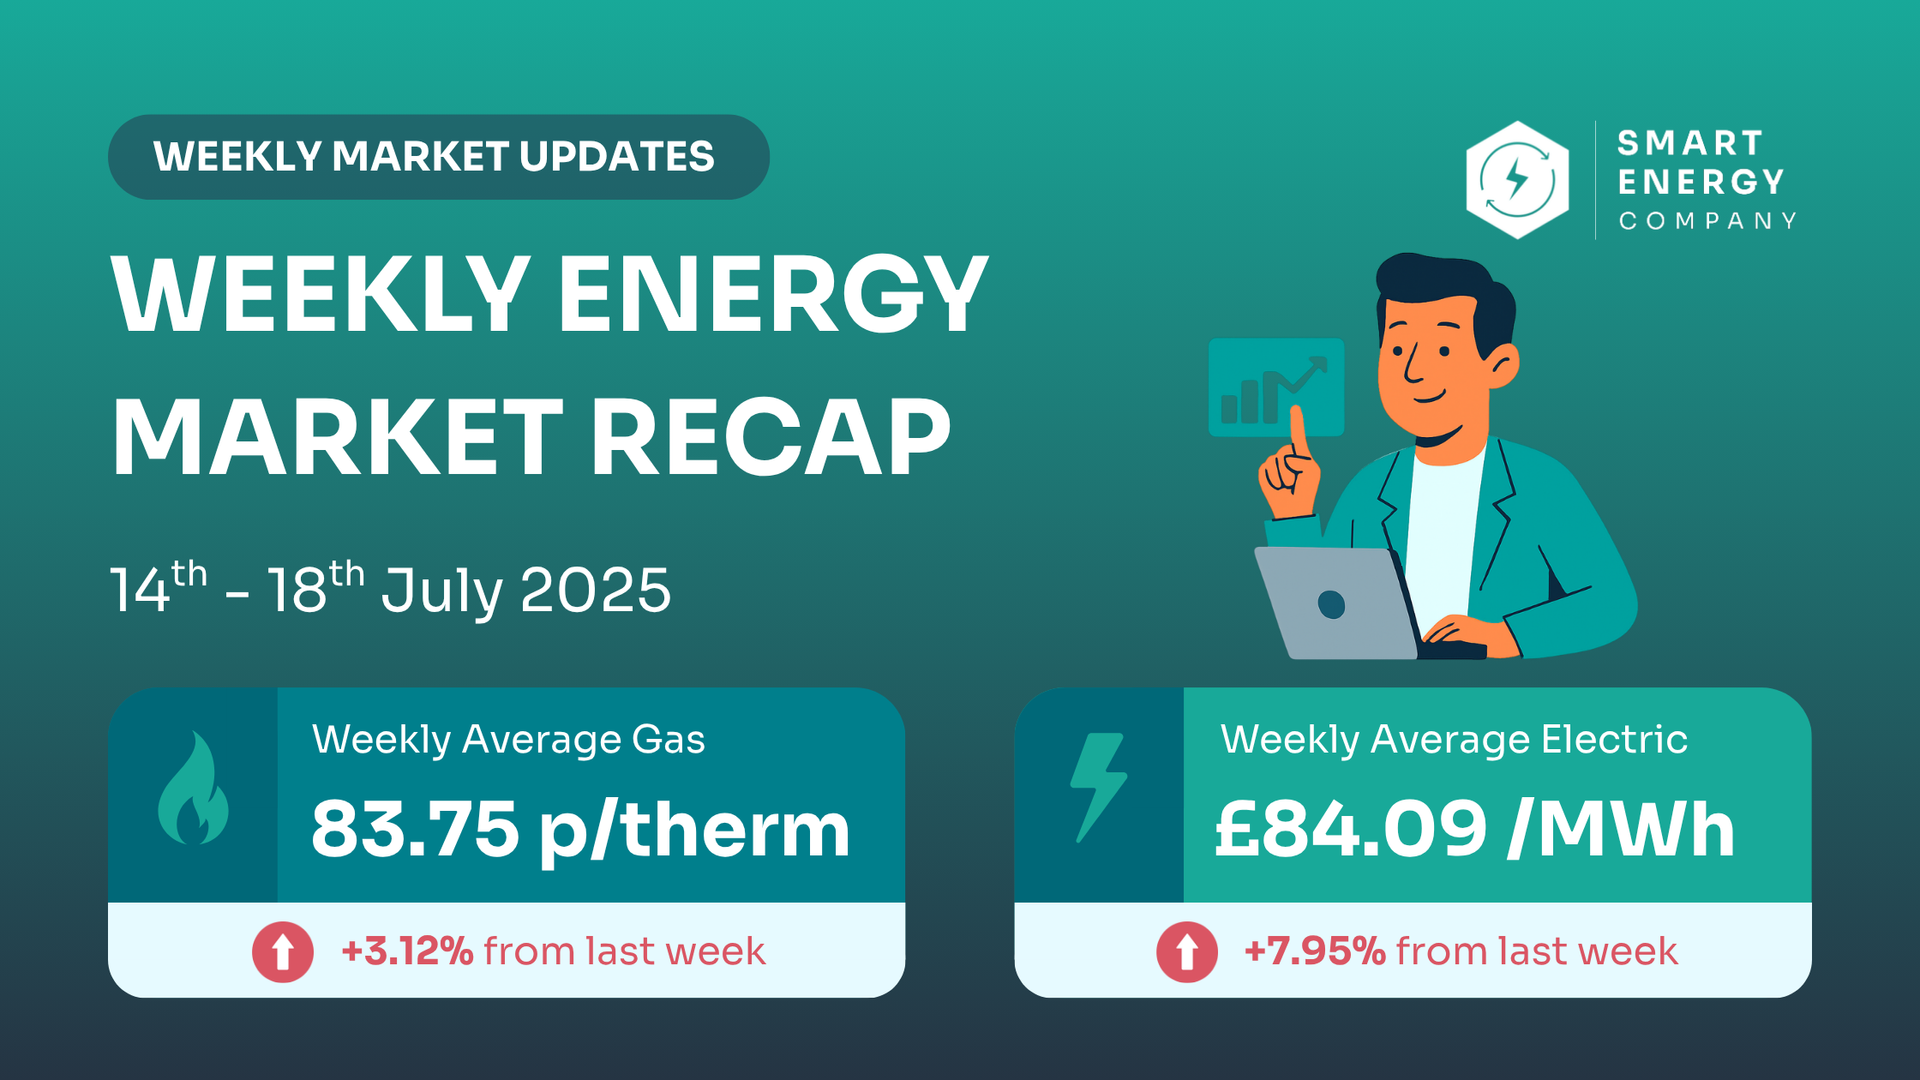
UK Energy Market Update: 14th –18th July 2025
Steady gas, volatile power — a mixed week for business energy buyers
💡 Summary at a Glance
| Market | Weekly Avg | Previous Week | % Change | Direction |
|---|---|---|---|---|
| Gas (NBP) | 83.75 p/th | 81.22 p/th | 🔺 +3.12% | Higher |
| Power (ELEC) | £84.09/MWh | £77.90/MWh | 🔺 +7.95% | Higher |
📈 Prices rose across both markets this week —
bad news for those waiting to fix.
🔌
Power climbed nearly 8%, reversing the dip we saw the week before.
⚡ Day-Ahead Prices Breakdown
| 📆 Date | ⚡ Electricity (£/MWh) | 🔥 Gas (p/th) |
|---|---|---|
| 15/07/2025 | 80.68 | 83.35 |
| 14/07/2025 | 85.08 | 81.50 |
| 13/07/2025 | 86.90 | 83.00 |
| 12/07/2025 | 89.89 | 84.90 |
| 11/07/2025 | 77.88 | 84.00 |
⚠️ No major pricing anomalies, but both gas and electricity rose steadily throughout the week.
📅 5-Week Price Trend
| Week Ending | Avg Gas (p/th) | Avg Power (£/MWh) |
|---|---|---|
| 18/07/2025 | 83.75 | £84.09 |
| 11/07/2025 | 81.22 | £77.90 |
| 04/07/2025 | 78.05 | £82.98 |
| 27/06/2025 | 87.72 | £58.82 ⚠️ |
| 20/06/2025 | 93.67 | £88.73 |
✅ Power is trending lower after June volatility — a positive sign.
⚠️ Gas has climbed 4% this week, reversing part of the recent softening.
📩 Ready to Check Prices?
👉 Avoid paying more than you need to.
Get your free quote today and compare live rates across 28+ suppliers.
🌍 What’s Driving the Market?
🟢 Gas Market Drivers
- 🔧 Norwegian maintenance at Nyhamna, Kollsnes, and Troll facilities caused big supply dips — cutting over 90mcm/day on 16 July alone
- 🇳🇴 Flows to UK recovered by Friday, but the damage was already priced in.
- ❄️ Temperature forecasts adjusted slightly down, but cooling demand remained above normal.
- 🛬 LNG sendout dipped — South Hook and Isle of Grain only supplied 9mcm/day by Friday
🔌 Power Market Drivers
- 🏭 Nuclear outages remain high: Hartlepool 2 and Heysham 1-2 still offline. Torness Unit 1 will also drop offline from 19 July
- 🌬️ Wind generation dropped midweek, leading to more gas-for-power demand.
- 🔌 Imports stable, but UK was still importing less via Belgium and the Netherlands compared to earlier in July.
- ☀️ Solar stayed strong, keeping peak pricing capped despite tight margins.
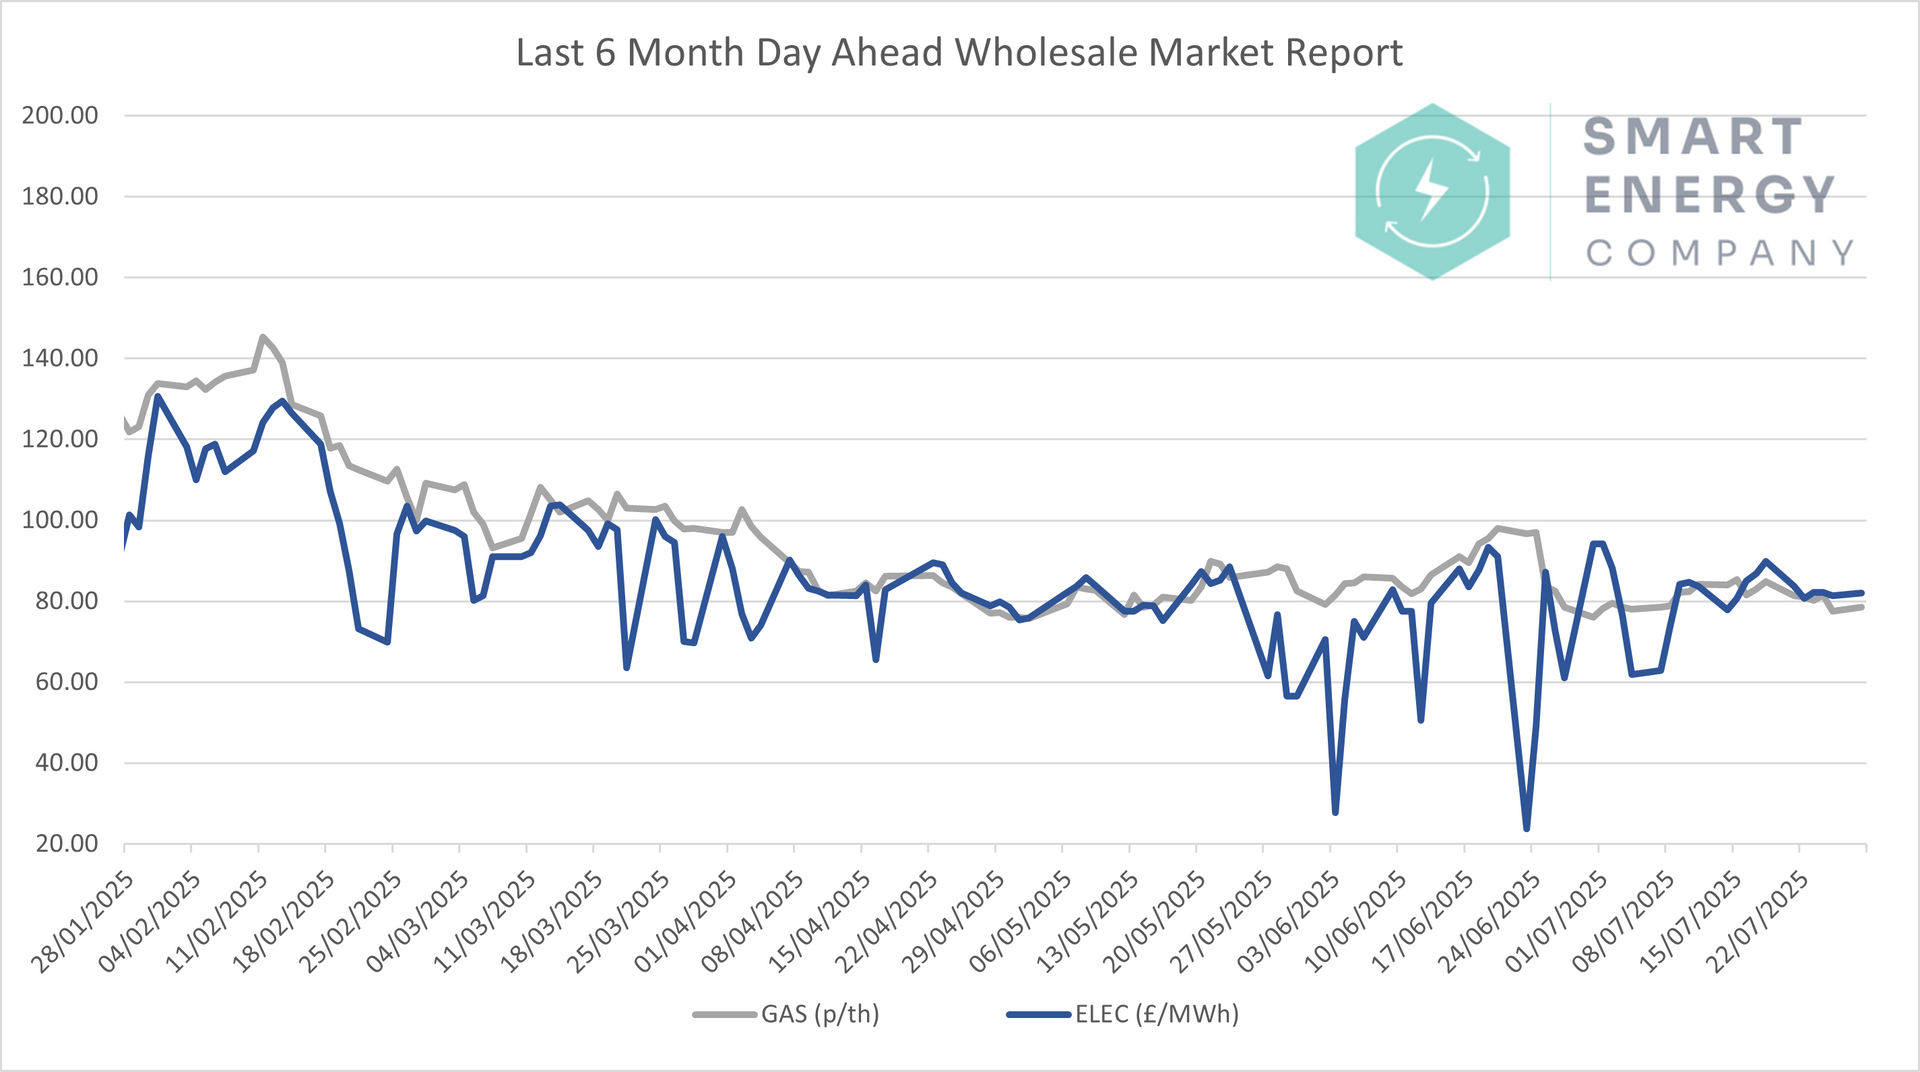
📈 6–Month Energy Market Trends
The chart below shows how
day-ahead gas and power prices have moved since January.
Gas is still trending down from winter highs, butelectricity remains unstable, driven by generation and demand imbalances.
💡 What This Means for Your Business
| Time Until Contract Ends | Fixed Contract Advice |
|---|---|
| 0–3 Months | ✅ Act now – rates are rising and suppliers will be factoring that into new quotes. |
| 3–6 Months | ⚖️ Monitor closely – you may catch a short-term dip, but don’t hold out too long. |
| 6–12 Months | 🧭 No action yet – but keep a close eye on trends. If pricing climbs further, early fixes could return. |
| 12+ Months | ⏳ No rush – use this period to plan your next steps. |
🔭 What to Watch Next Week
- 🔧 Norwegian outage risk remains: Gassco expects repairs to finish by early week, but delays are possible.
- 🛬 LNG arrivals due from Algeria, US, Nigeria and Russia — watch closely for delivery confirmations.
- ☀️ Hot weather and light winds will impact both gas demand and power prices.
- ⚛️ Torness Unit 1 offline from 19 July – further strain on baseload supply.
🔭 Next Steps
Ready to Lock in Better Rates or Stay Ahead of the Market?
Our experts monitor global energy movements so you don’t have to—take control now.
💬 Final Thoughts
This week was a turning point:
- 🔺 Gas and power both moved higher — reversing early July's dip
- 🔧 Supply risks remain real, and heat is keeping demand elevated
- 📈 Forward contract rates are also climbing — early action may avoid further hikes
If you're unsure where you stand, we’re here to guide you through it — with clear options, not pressure.
More market intelligence.
160+ articles, updated every trading day. Free to read, no sign-up.