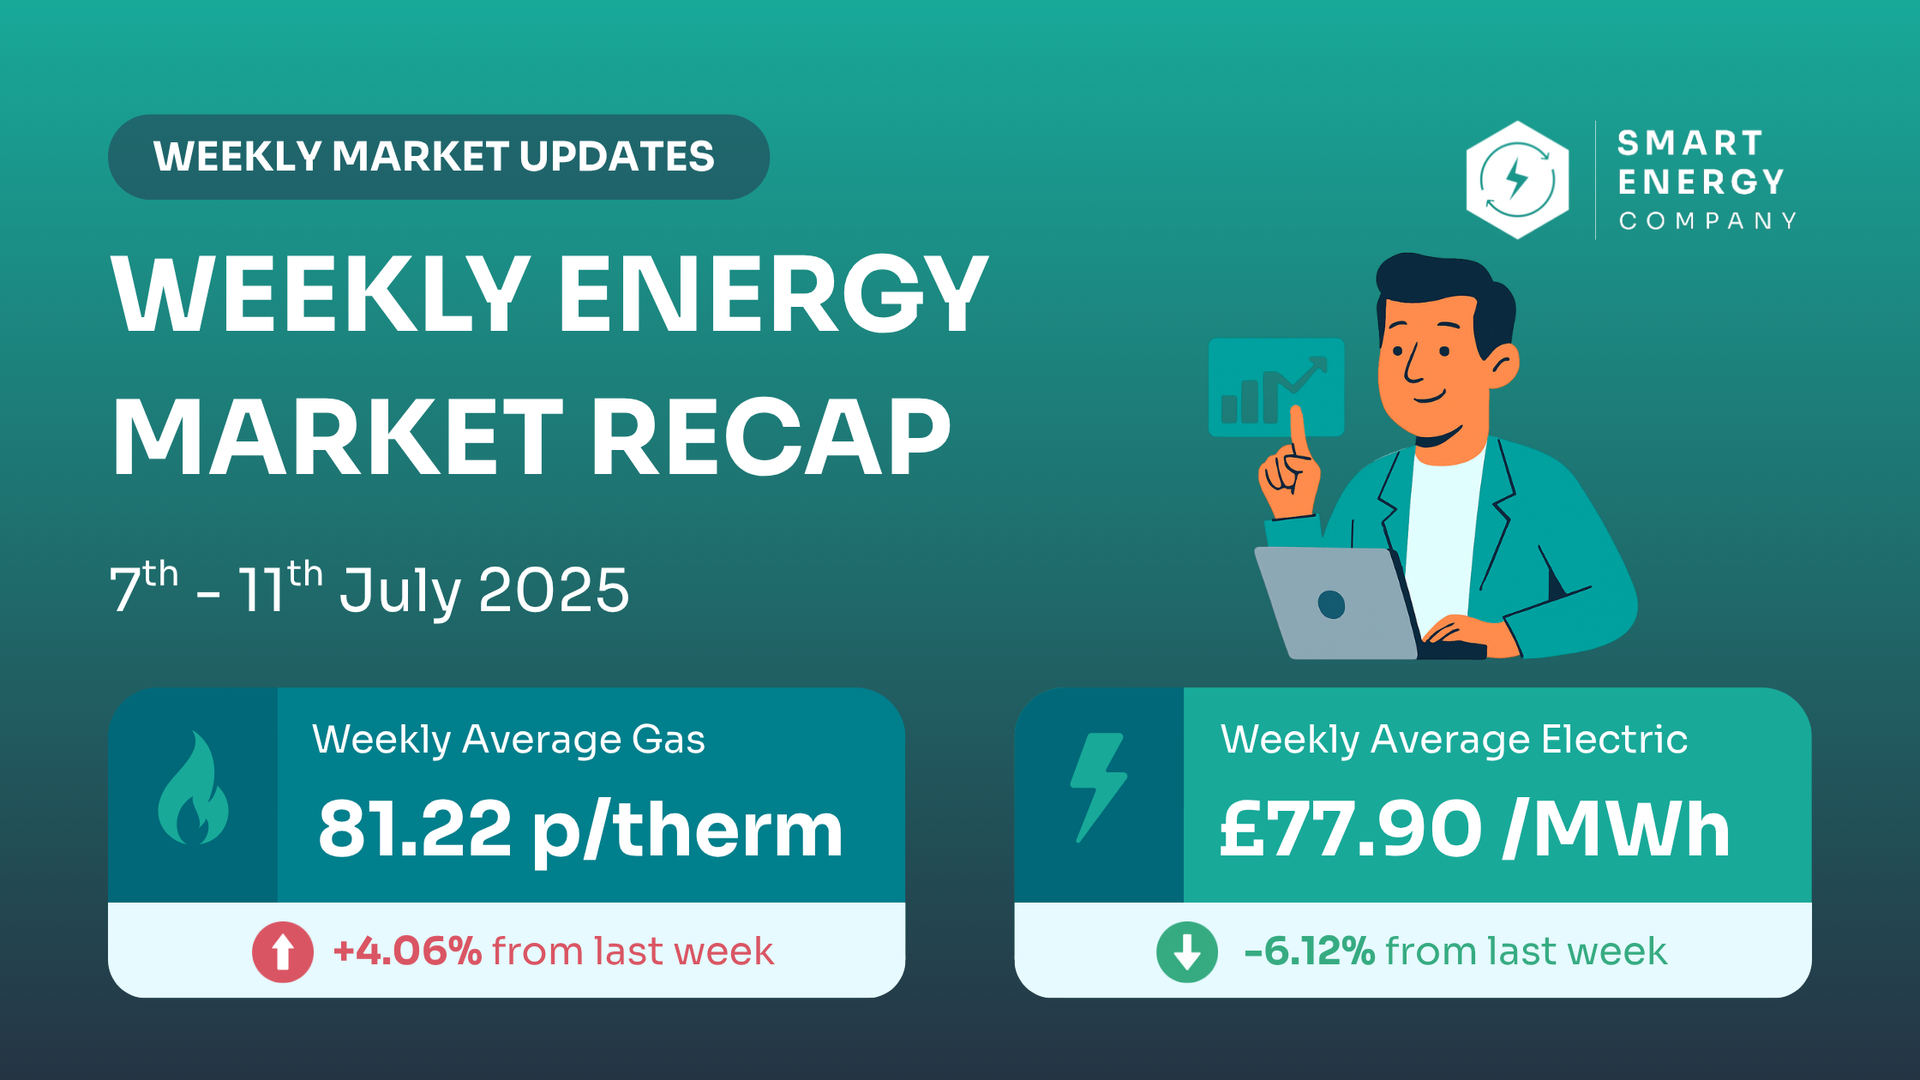
UK Energy Market Update: 7th –11th July 2025
Steady gas, volatile power — a mixed week for business energy buyers
💡 Summary at a Glance
| Market | Weekly Avg | Previous Week (30 Jun-4 Jul) | % Change | Direction |
|---|---|---|---|---|
| Gas (NBP) | 81.22 p/th | 78.05 p/th | 🔺 +4.07% | Slightly Higher |
| Power (ELEC) | 77.90/MWh | £82.98/MWh | 🔻 -6.12% | Lower |
✅
Gas prices edged higher, driven by hotter weather and limited LNG.
⚠️
Power dropped week-on-week, but this includes a sharp and unusual price dip early in the week.
⚡ Day-Ahead Prices Breakdown
| 📆 Date | ⚡ Electricity (£/MWh) | 🔥 Gas (p/th) |
|---|---|---|
| 11/07/2025 | 83.76 | 84.20 |
| 10/07/2025 | 81.32 | 82.70 |
| 09/07/2025 | 84.27 | 82.25 |
| 08/07/2025 | 73.82 | 78.86 |
| 07/07/2025 | 62.95 | 78.50 |
| Avg | £82.98 | 78.05p |
⚠️ Electricity dropped to just £62.95 on Monday — likely due to high solar output and low early-week demand. Prices recovered quickly and held above £83 from Wednesday onwards.
📅 5-Week Price Trend
| Week Ending | Avg Gas (p/th) | Avg Power (£/MWh) |
|---|---|---|
| 11/07/2025 | 81.22 | £77.90 |
| 04/07/2025 | 78.05 | £82.98 |
| 27/06/2025 | 87.72 | £58.82 ⚠️ |
| 20/06/2025 | 93.67 | £88.73 |
| 13/06/2025 | 84.10 | £73.59 |
✅ Power is trending lower after June volatility — a positive sign.
⚠️ Gas has climbed 4% this week, reversing part of the recent softening.
📩 Ready to Check Prices?
👉 Avoid paying more than you need to.
Get your free quote today and compare live rates across 28+ suppliers.
🌍 What’s Driving the Market?
🟢 Gas Market Summary
- Hotter weather pushed cooling demand up, raising pressure on prices.
- Norwegian pipeline flows reduced by Troll maintenance (~15mcm/day impact).
- No new LNG deliveries this week; South Hook and Isle of Grain held steady at 9mcm/day.
- UK storage remains strong, offering some price stability.
🔌 Power Market Summary
- Prices dropped sharply on Monday due to low demand and strong solar generation.
- By Wednesday, electricity returned to above £83/MWh, reflecting tighter margins and limited nuclear output.
- Hartlepool 2 and Torness are due back mid-July, which may ease baseload prices.
- Interconnectors ran normally, helping support UK supply.
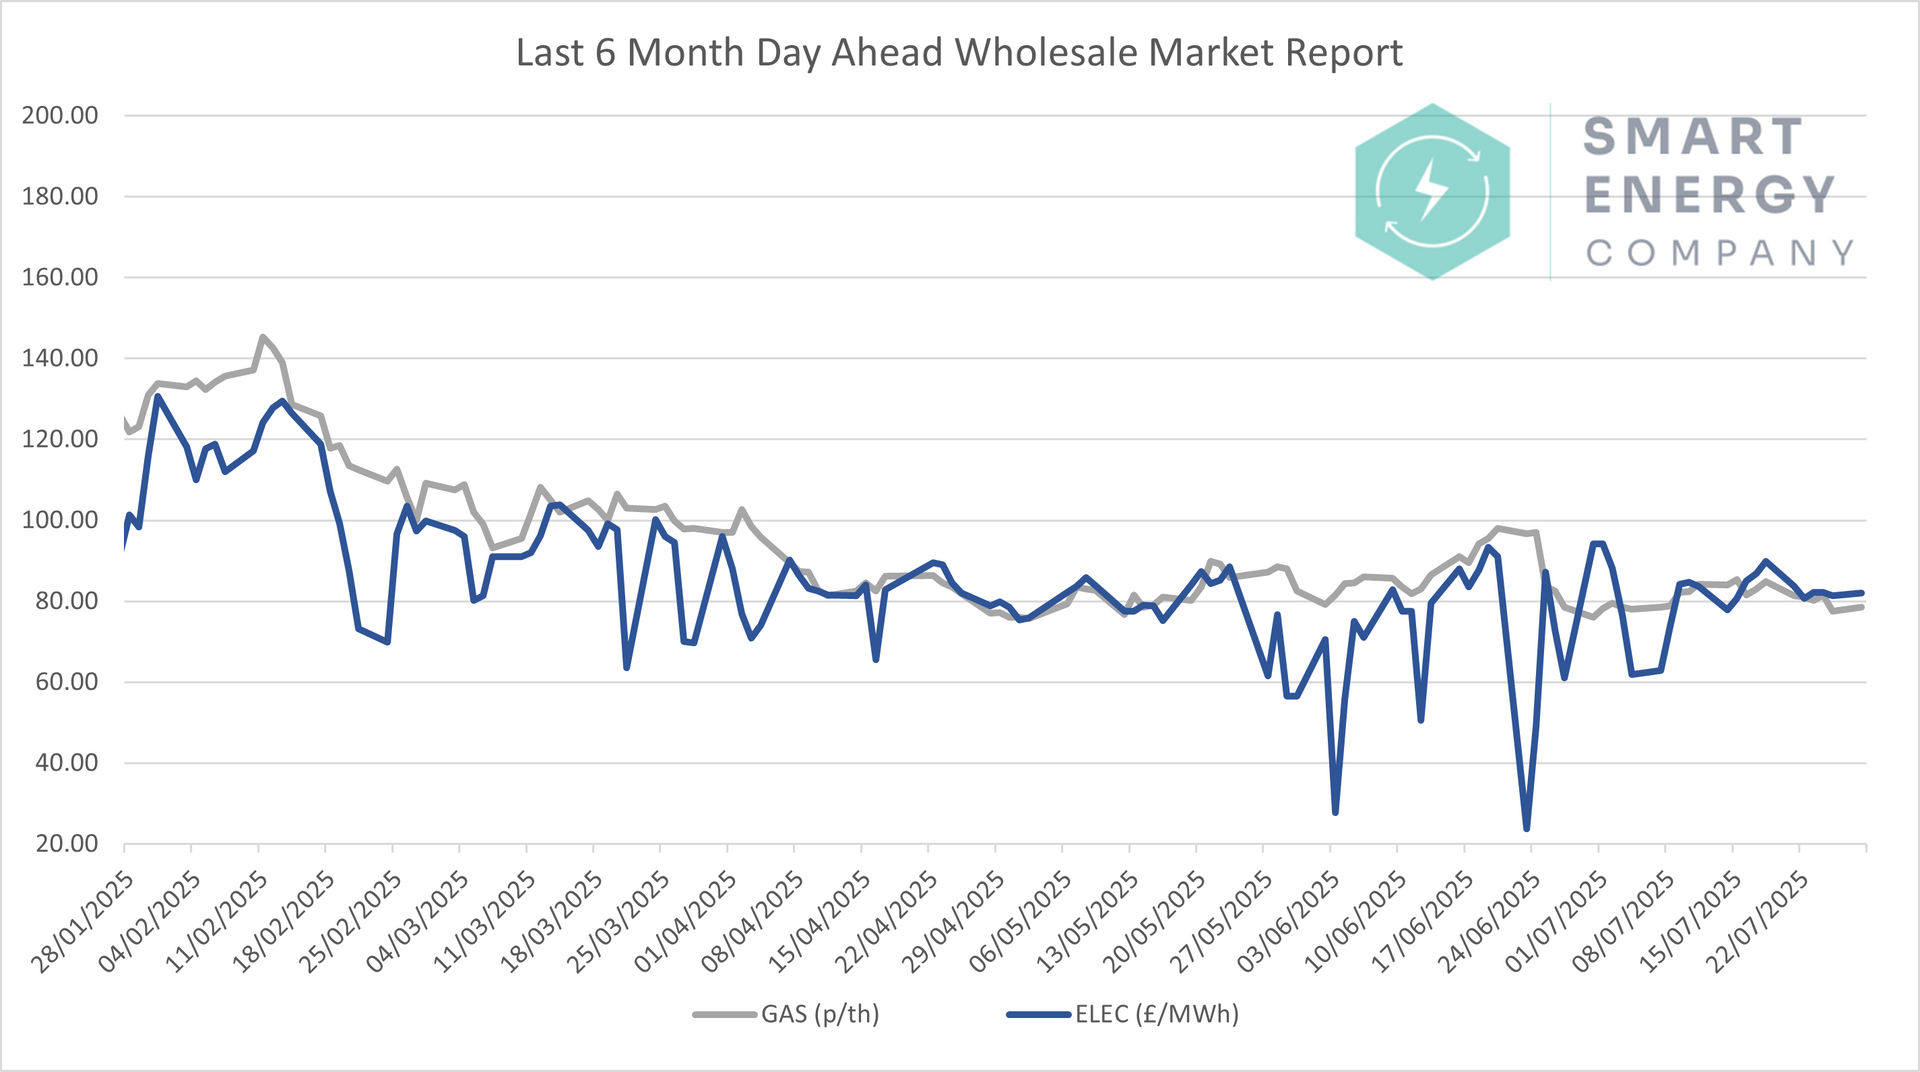
📈 6–Month Energy Market Trends
The chart below shows how
day-ahead gas and power prices have moved since January.
Gas is still trending down from winter highs, butelectricity remains unstable, driven by generation and demand imbalances.
💡 What This Means for Your Business
| Contract Renewal Timing | Fixed Contract Advice |
|---|---|
| Renewing within 3 months | 6+ months away |
| In 3–6 months | Monitor forward curves closely — small movements are adding ££ to contract values. |
| In 3–6 months | Long-term visibility is improving. Consider planning discussions or forward quotes. |
🔭 What to Watch Next Week
- 🌡️ Heatwave continues – likely to drive further demand for cooling
- ⛽ Next LNG arrival due 15 July – could ease supply pressure
- 🔧 Norwegian maintenance ongoing – may restrict gas exports
- ⚛️
Return of 1GW of nuclear power expected – could help stabilise power prices
🔭 Next Steps
Ready to Lock in Better Rates or Stay Ahead of the Market?
Our experts monitor global energy movements so you don’t have to—take control now.
💬 Final Thoughts
This week shows how unpredictable things can get — especially in electricity markets.
- ✅ Power prices dropped, offering some relief
- ⚠️ Gas prices rose, and supply constraints could keep pressure on
- 🧭 For those due to renew soon, the power market looks more favourable than gas right now
We’ll continue tracking these shifts so you can make smart, well-timed decisions — without the spin.
More market intelligence.
160+ articles, updated every trading day. Free to read, no sign-up.